 English
 Deutsch
Menu
Manuals
Charts
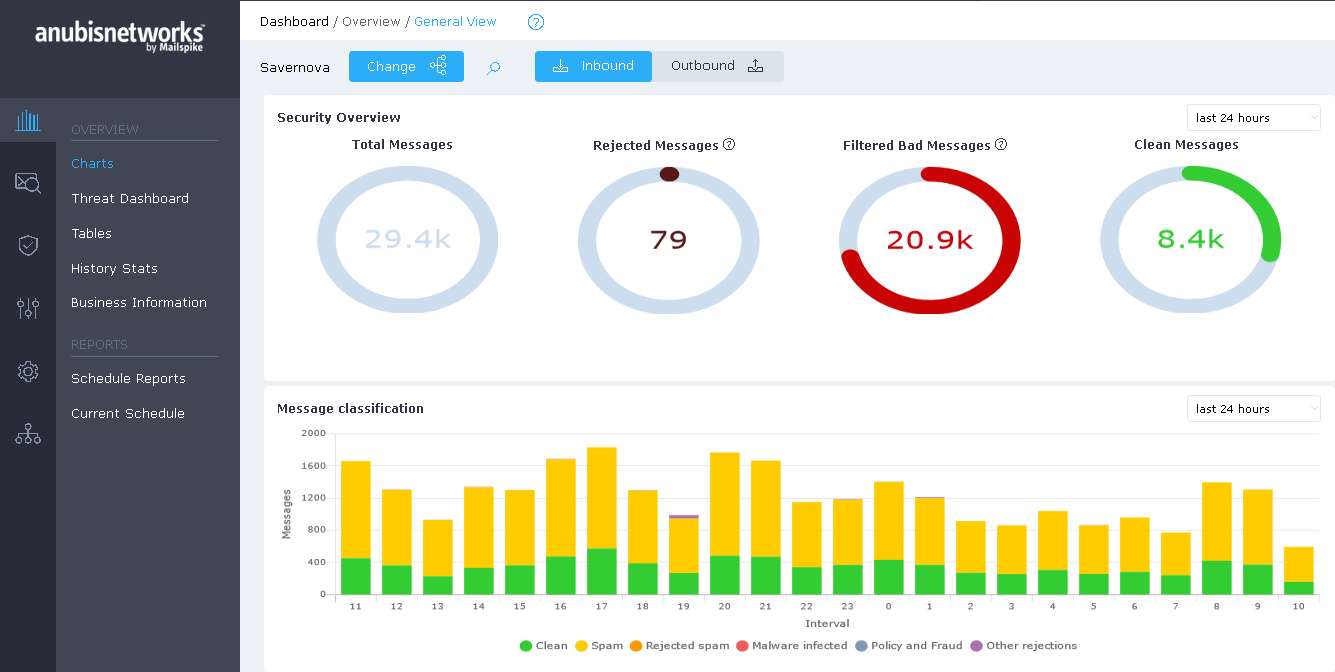
The Dashboard section shows graphical representations of the classification and volume of data for different periods (last 24 hours, last 30 days and last year are as options available).
The Dashboard section shows graphical representations of the classification and volume of data for different periods (last 24 hours, last 30 days and last year are as options available).